If I think of the distance estimator δ as a scalar field δ(r) in the physical sense of the word "field", then a DE raytracer is simply a piece of code that renders the δ=0 iso potential surface. There is, however, nothing special about δ=0, other surfaces can be rendered as well, of course. The only problem here is how to show any surface δ>0 without obscuring the "lower" surfaces.
One way to go would be to show only fractions of some higher-δ surface, such that the lower one/s can be seen where the higher one/s have "holes" of some sort:
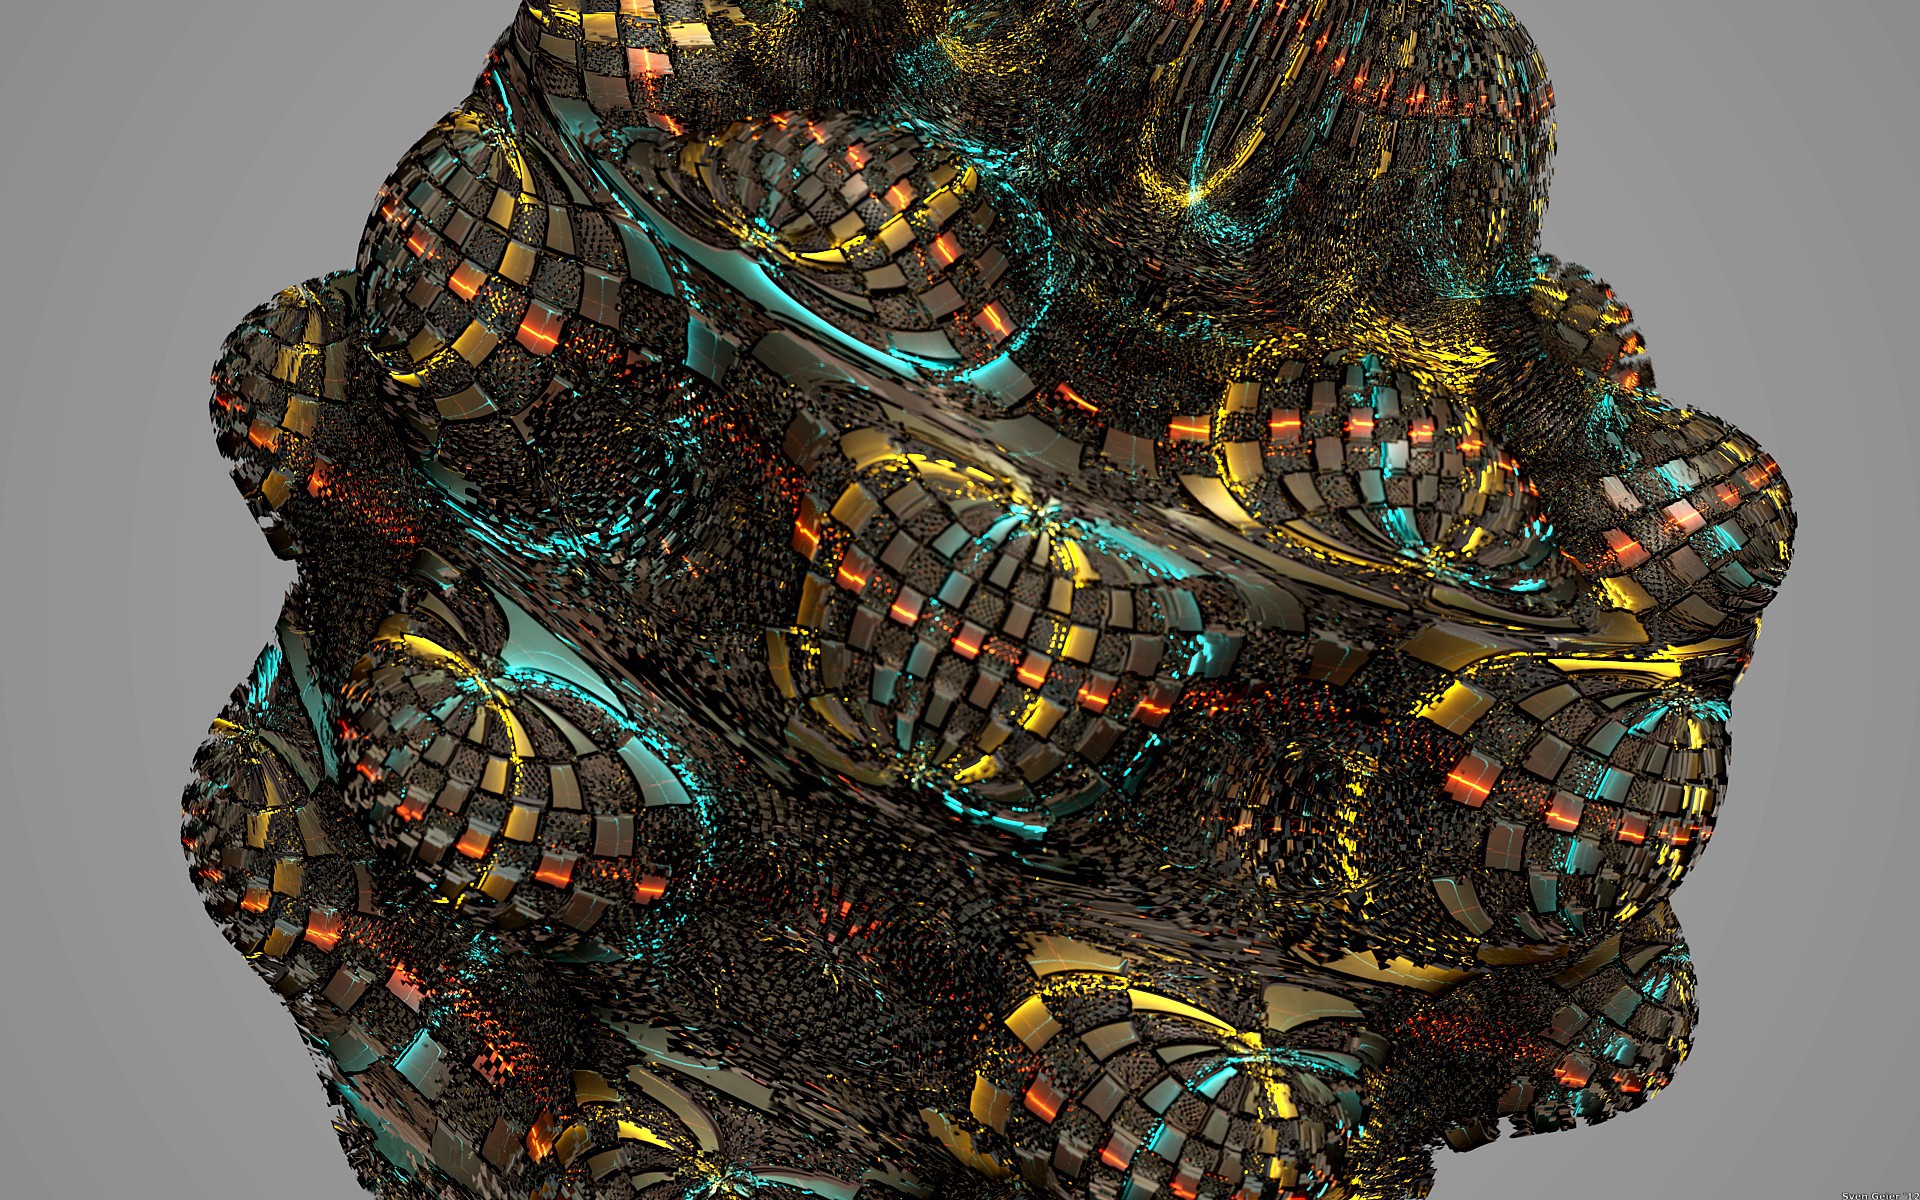
Checkered
Wedge
Top View
(All images on this page can be clicked to yield much larger renders)
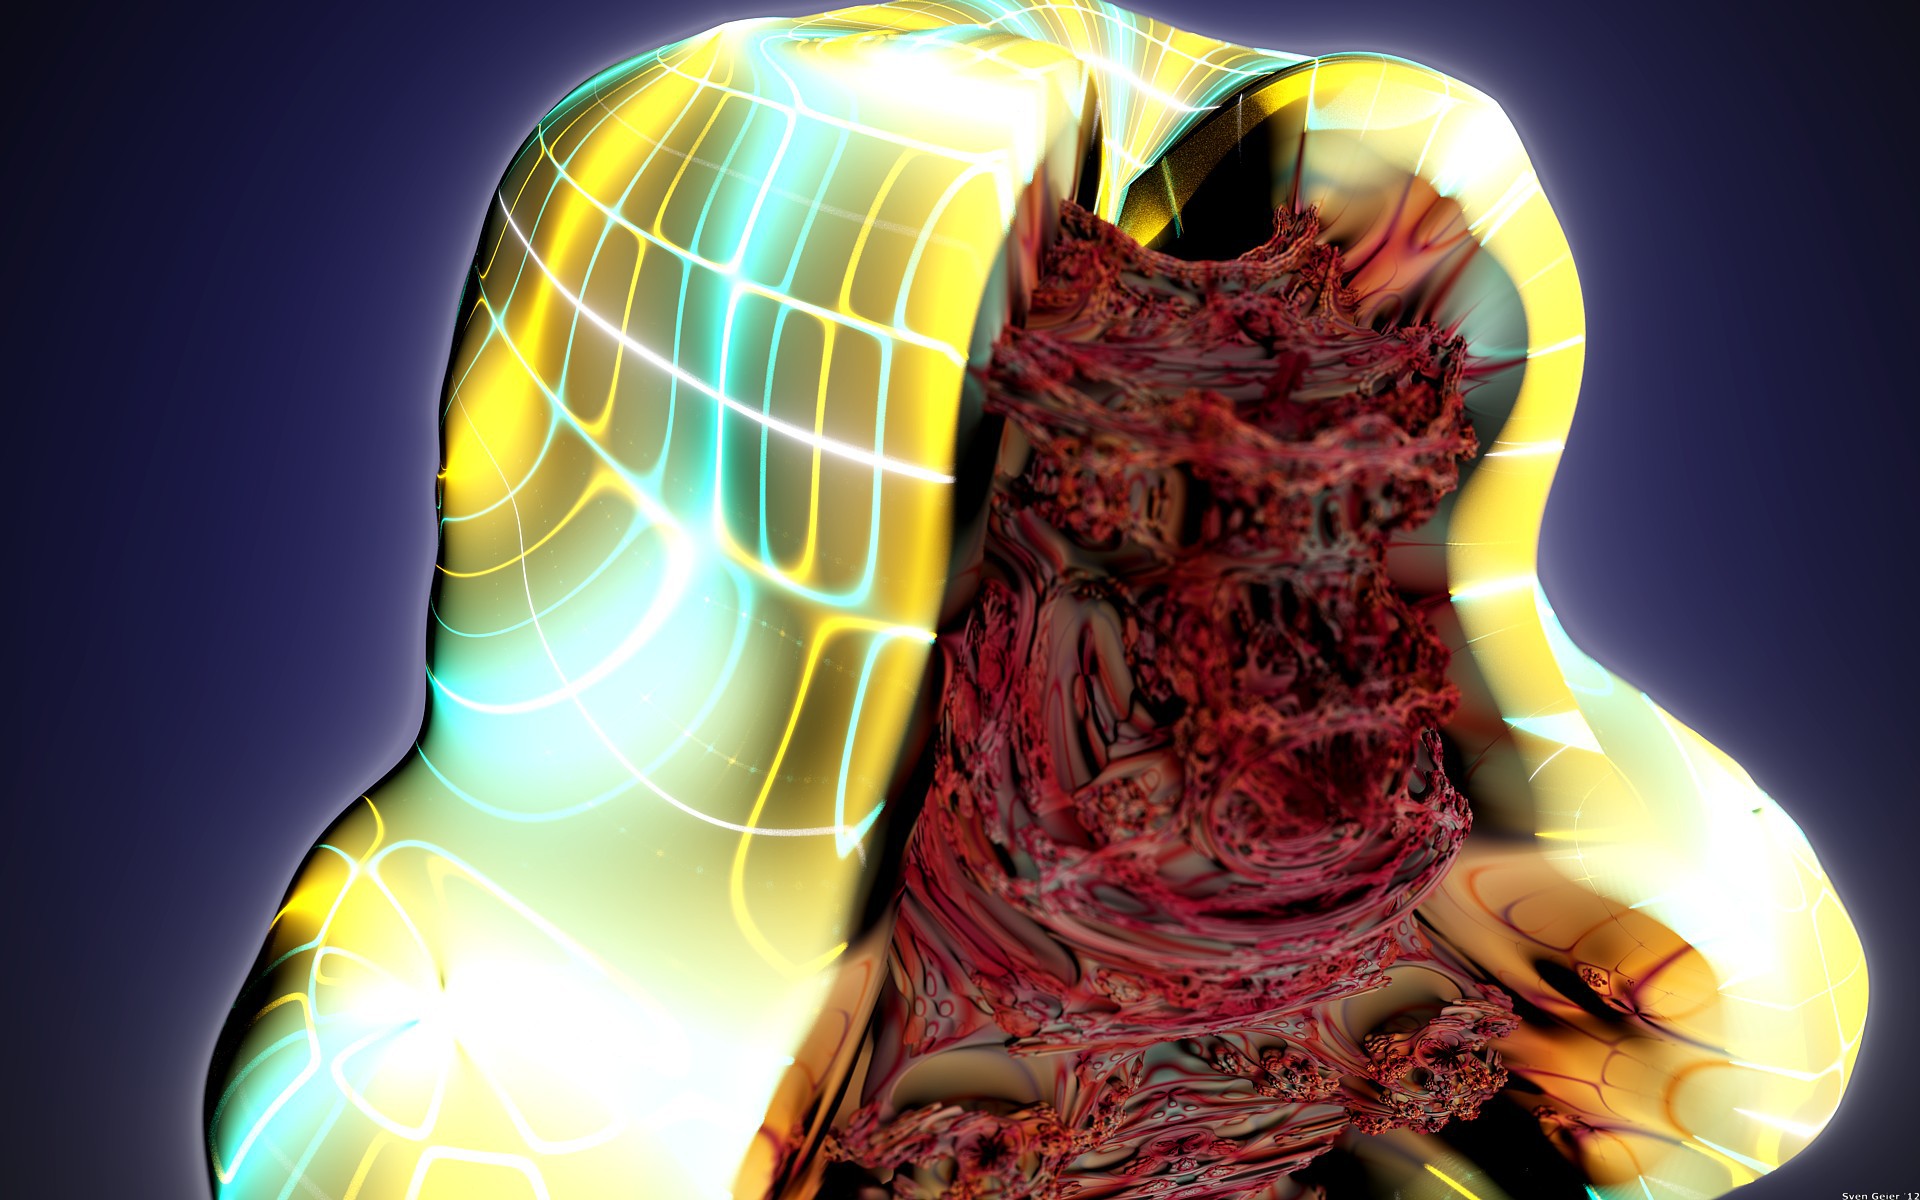
But what I find the most aesthetically pleasing is an approach where the "outer" iso potential surface is only hinted at by way of drawing certain lines onto them. In the most primitive case, these could just be latitude rings:
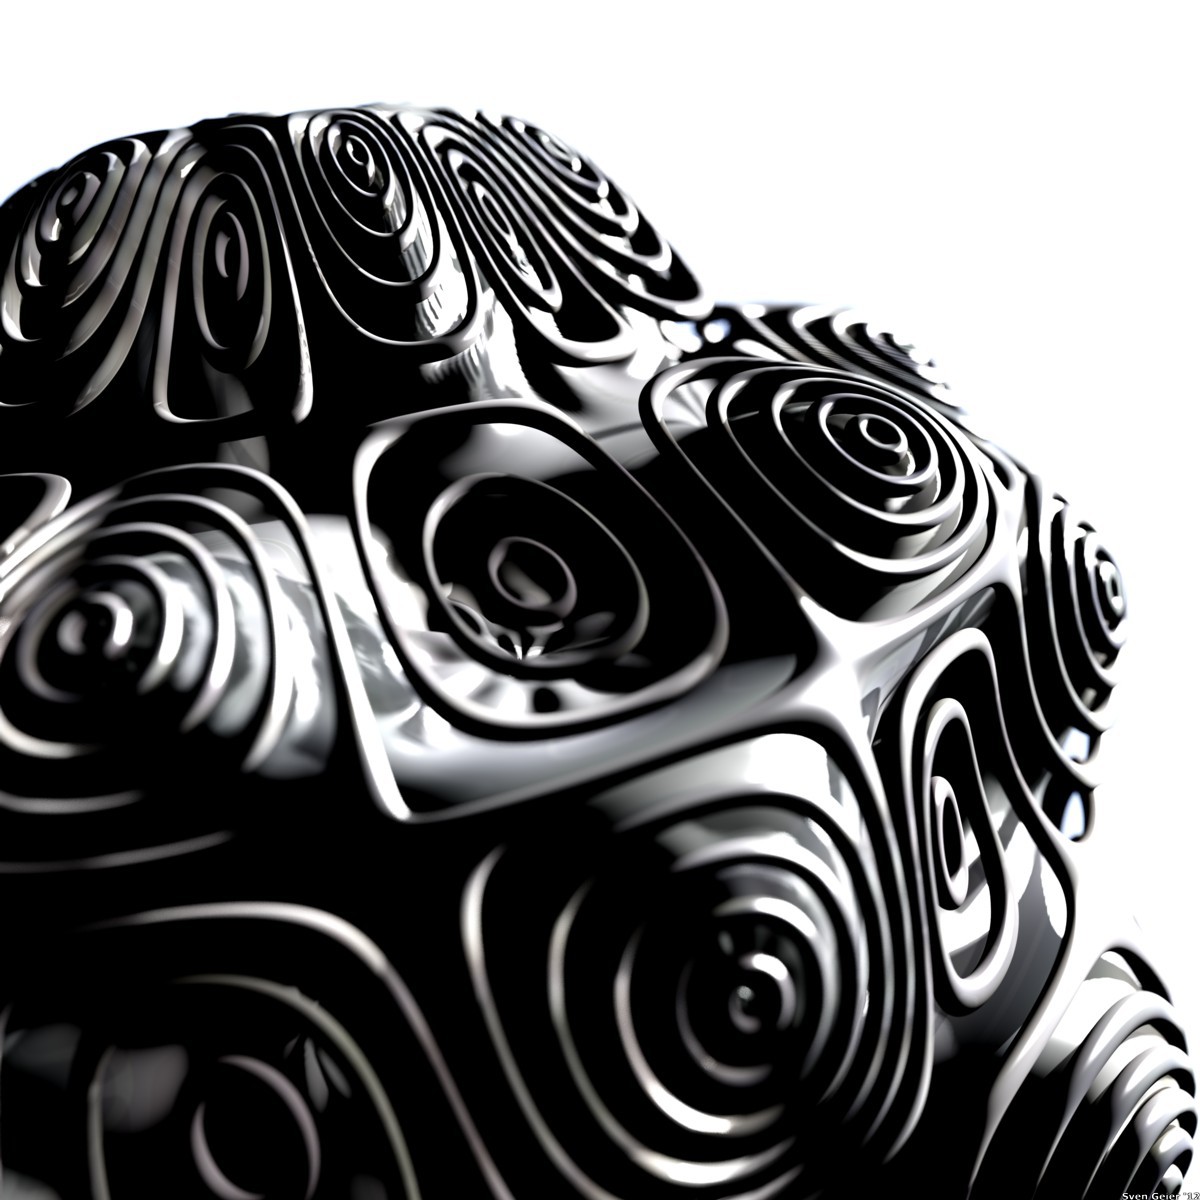
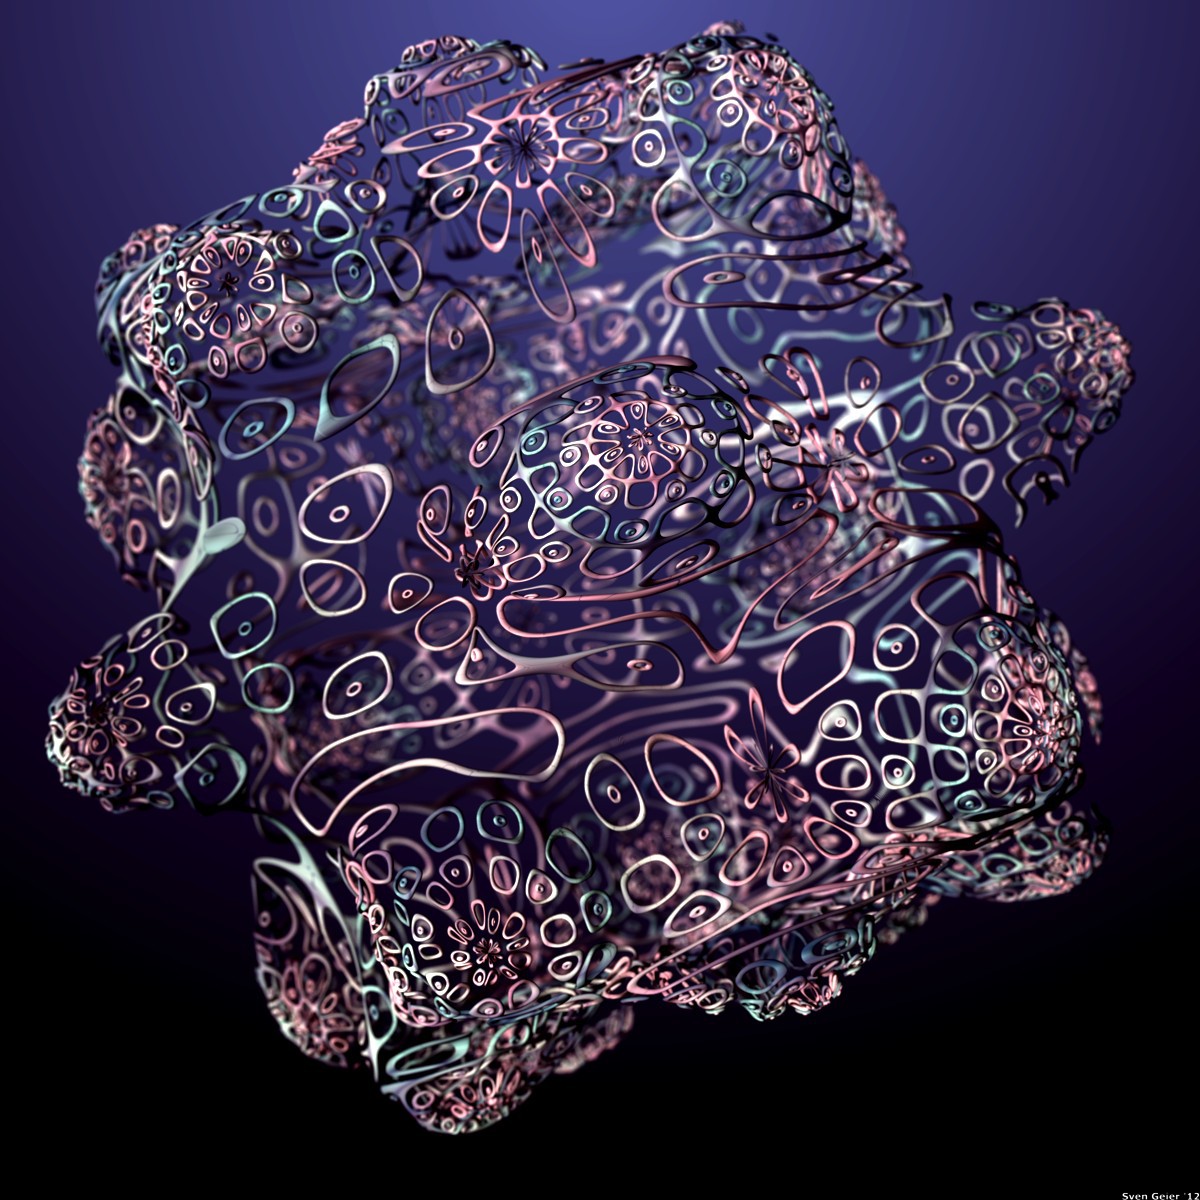
but there is a more intriguing possibility since the computation of δ yields a gradient as well as a value. Thus one can paint iso-potential lines of the gradient onto the isopotential surface one wants to hint at:
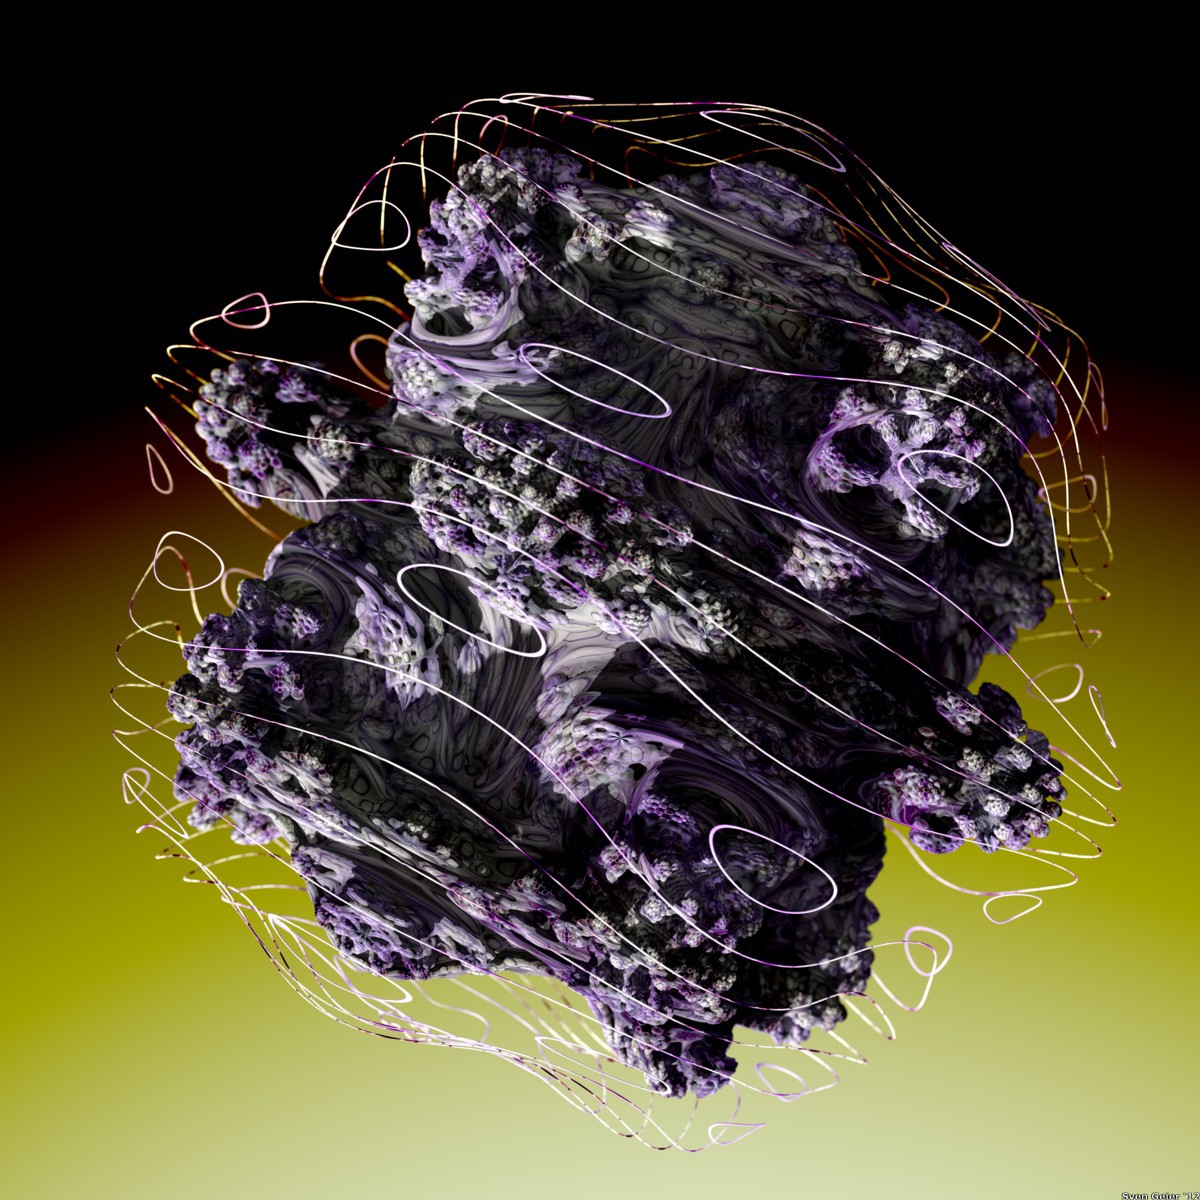
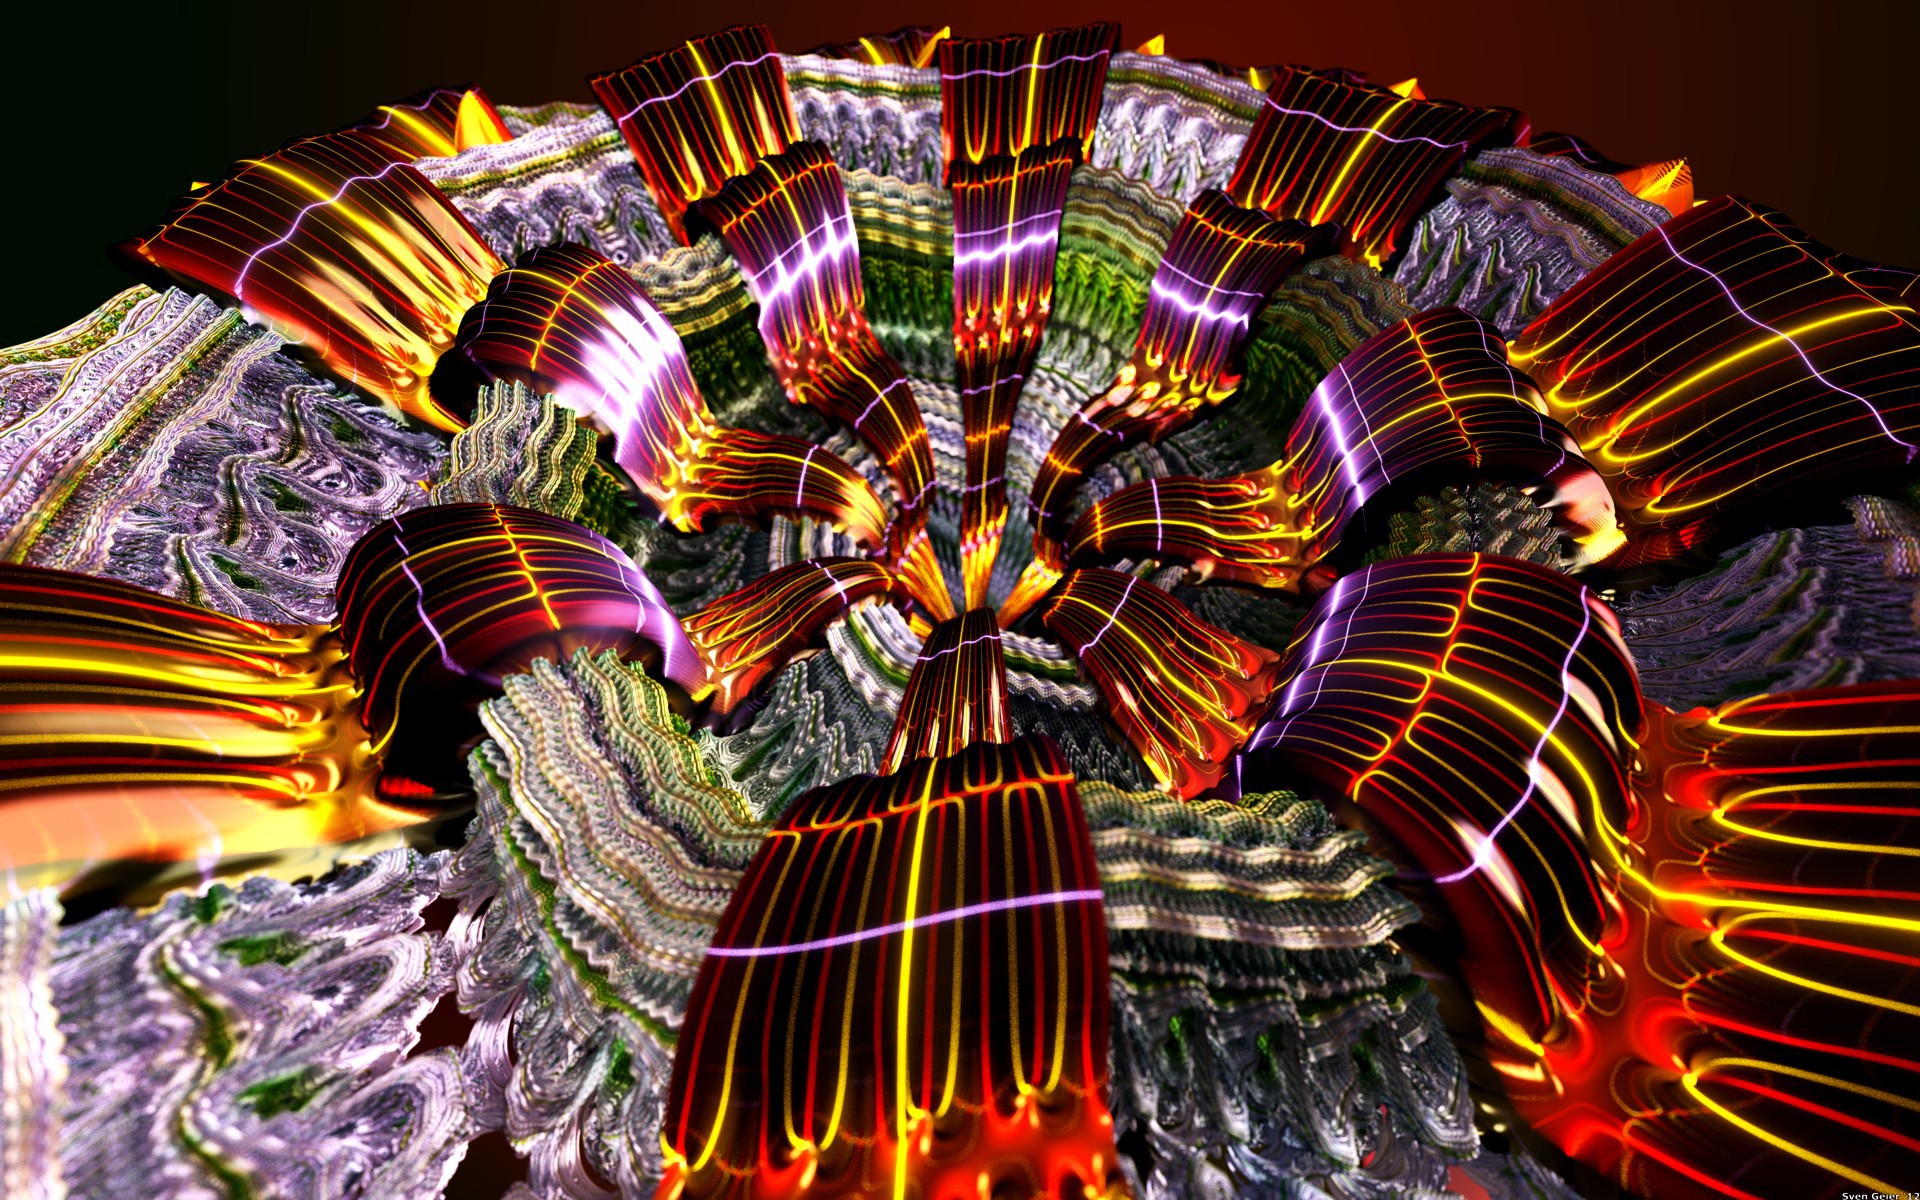
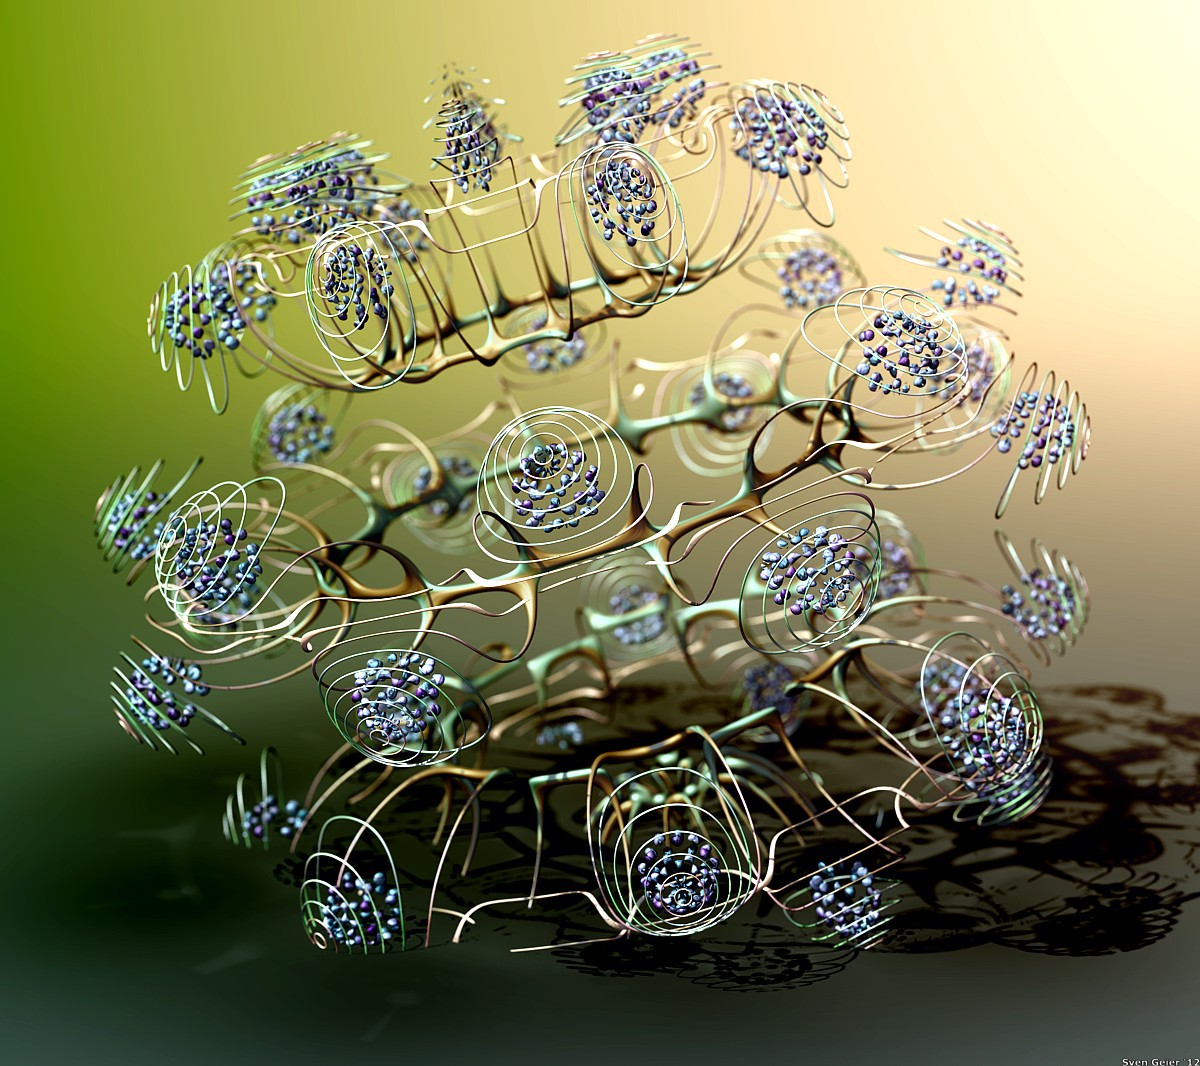
For sufficiently dense isopotential lines, they can become the center of the image and can dominate the visible shape to the point where the object itself can be omitted in favor of showing the iso-surfaces alone:
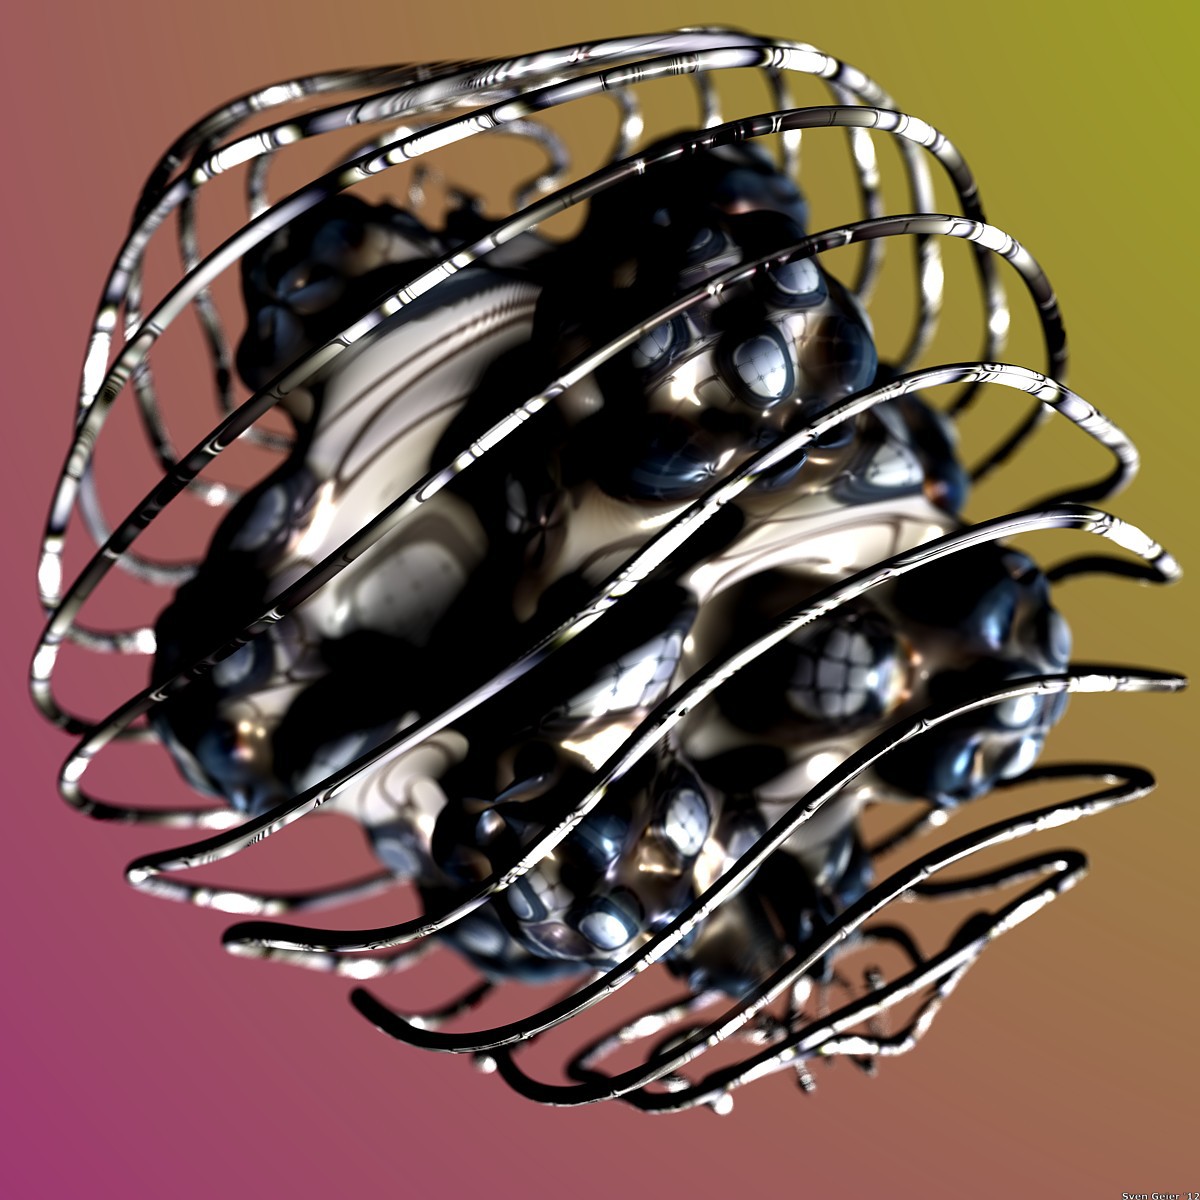
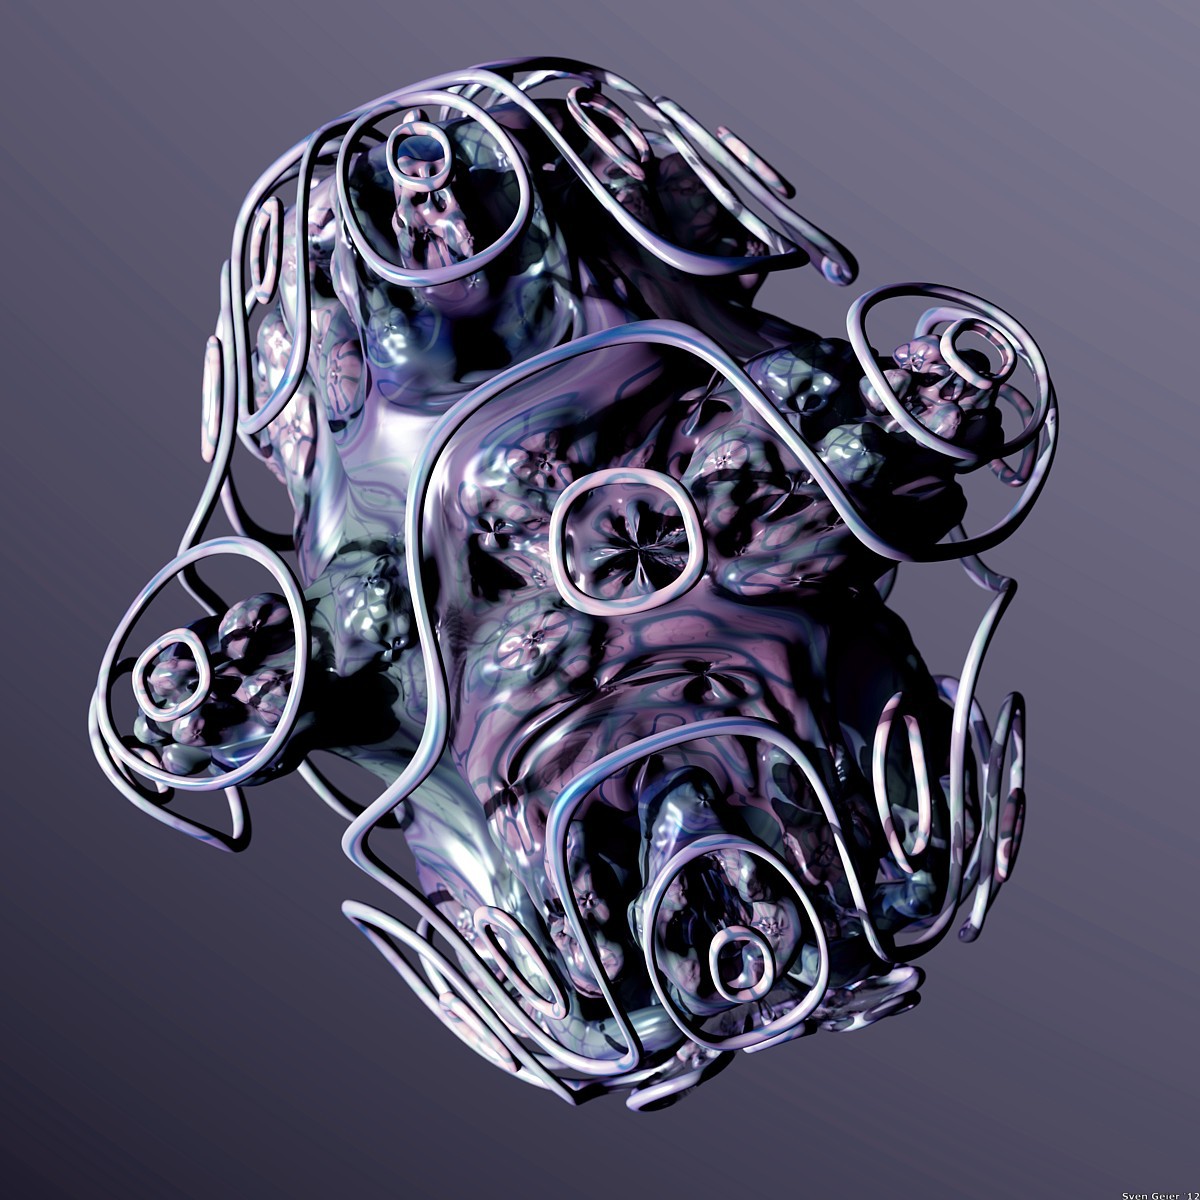
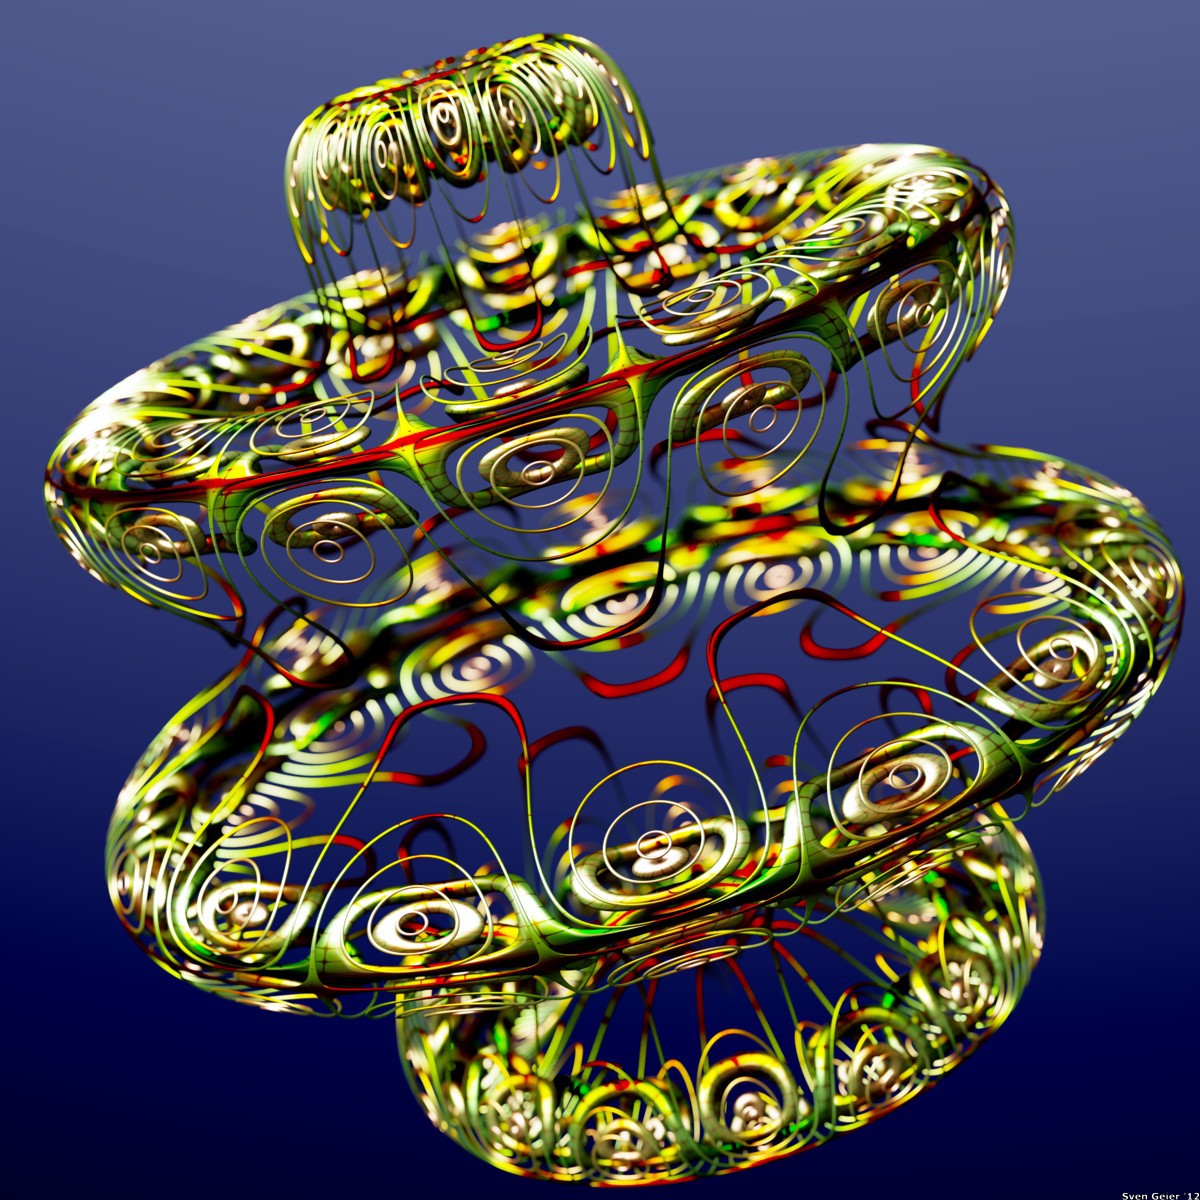
Going into a different direction, bare latitude rings can actually be made quite interesting by again not actually rendering their own δ=0 surface but higher-potential sufaces around them. Or even the surfaces around those surfaces:

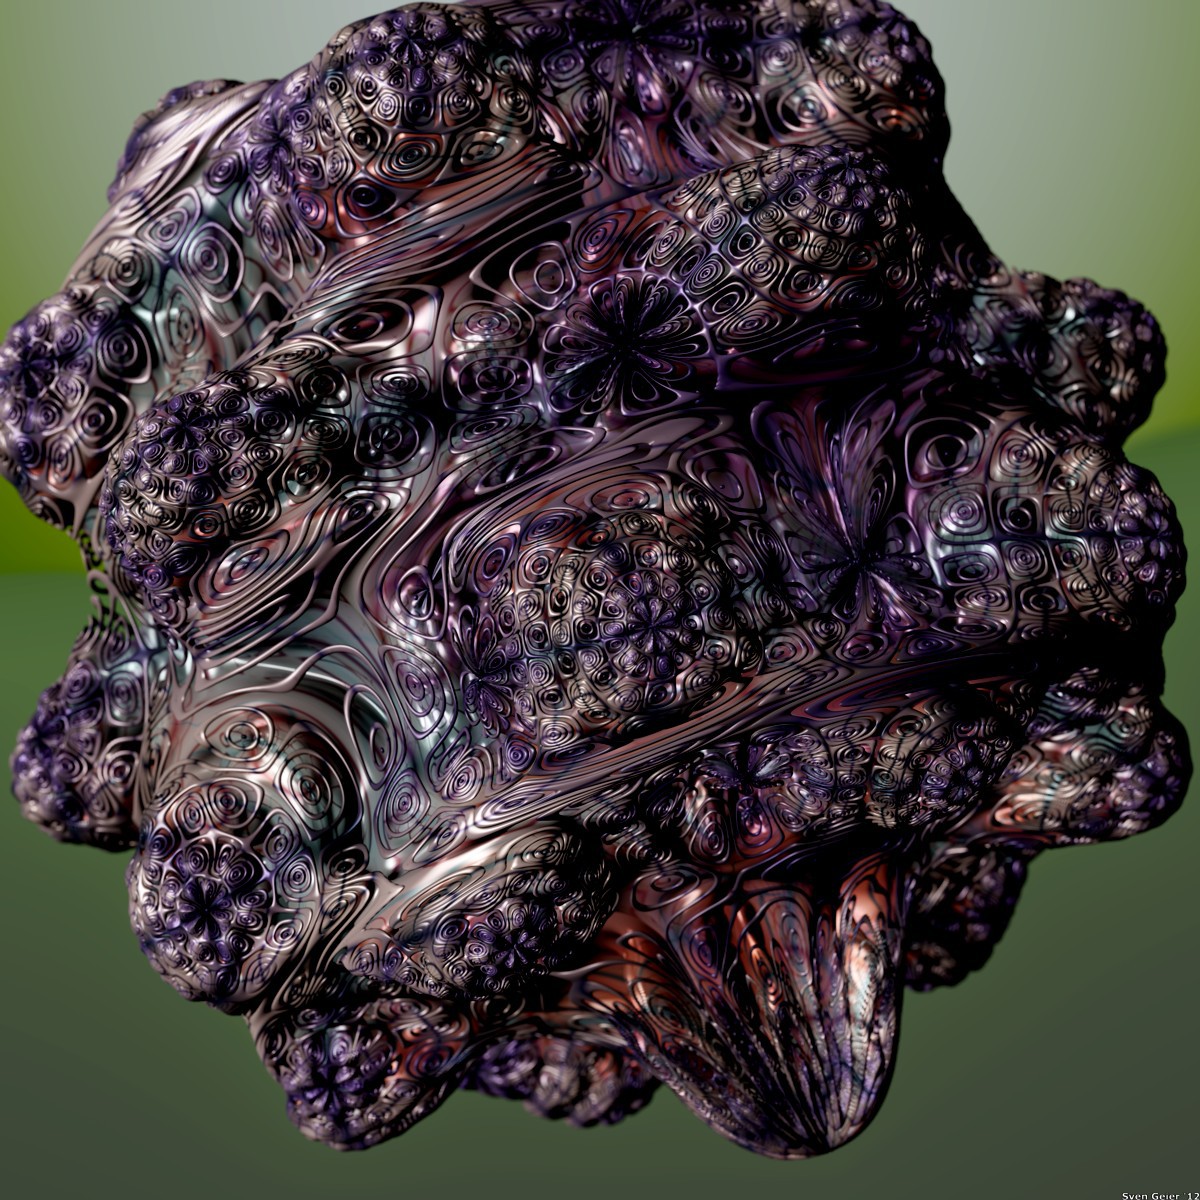
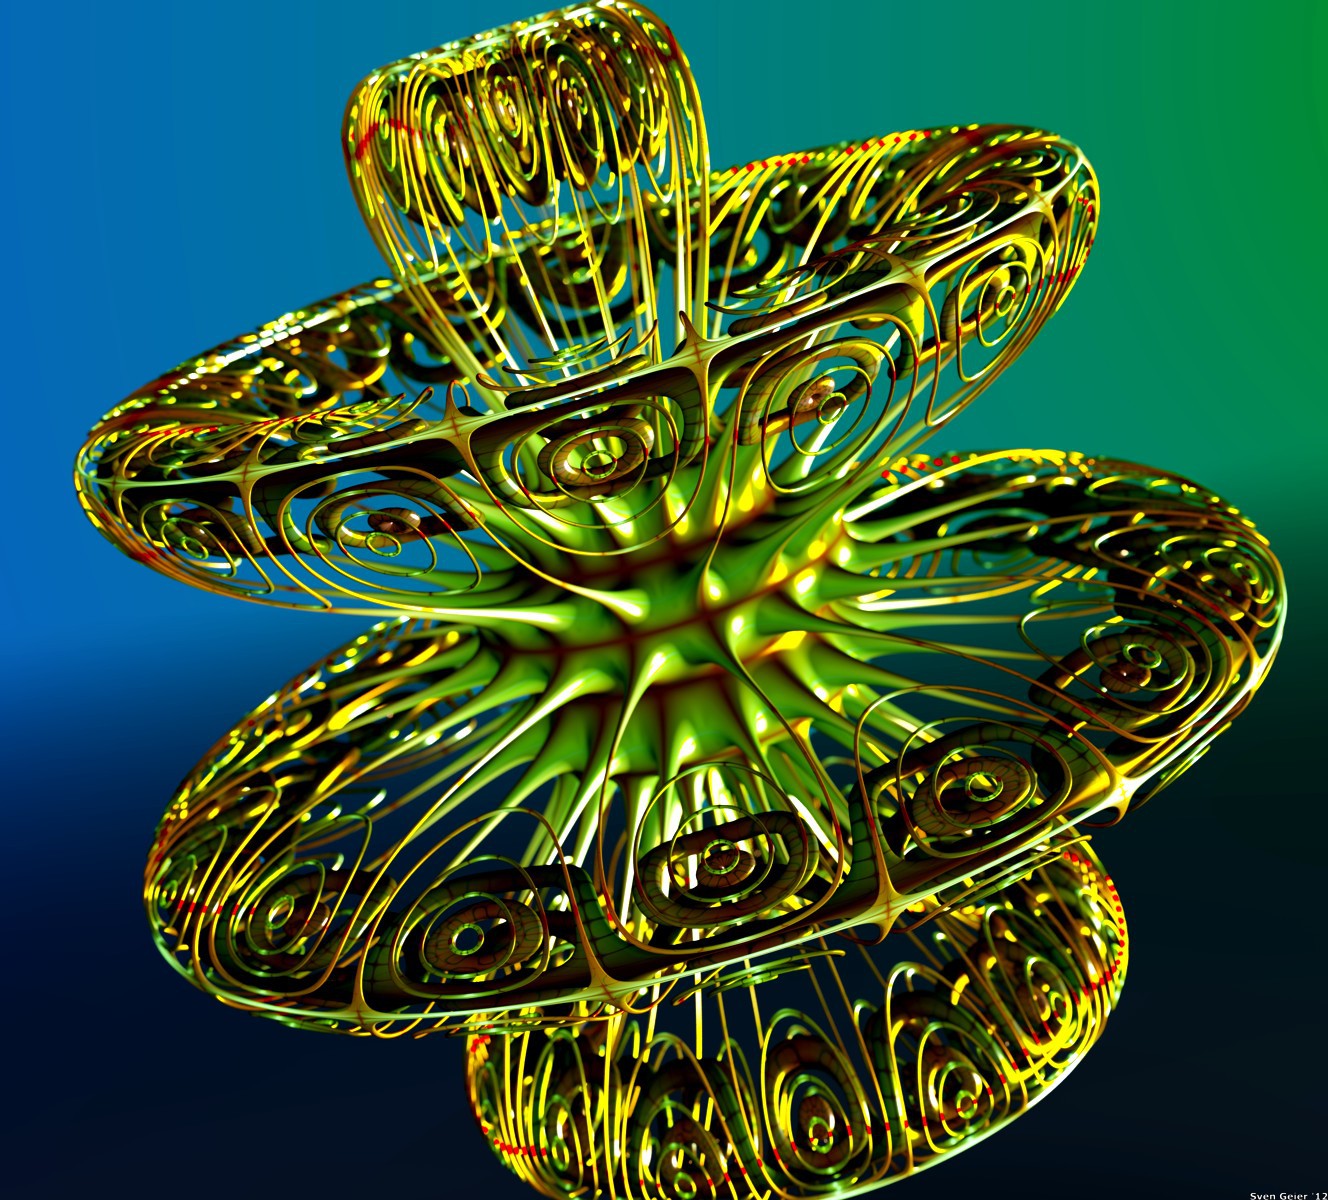
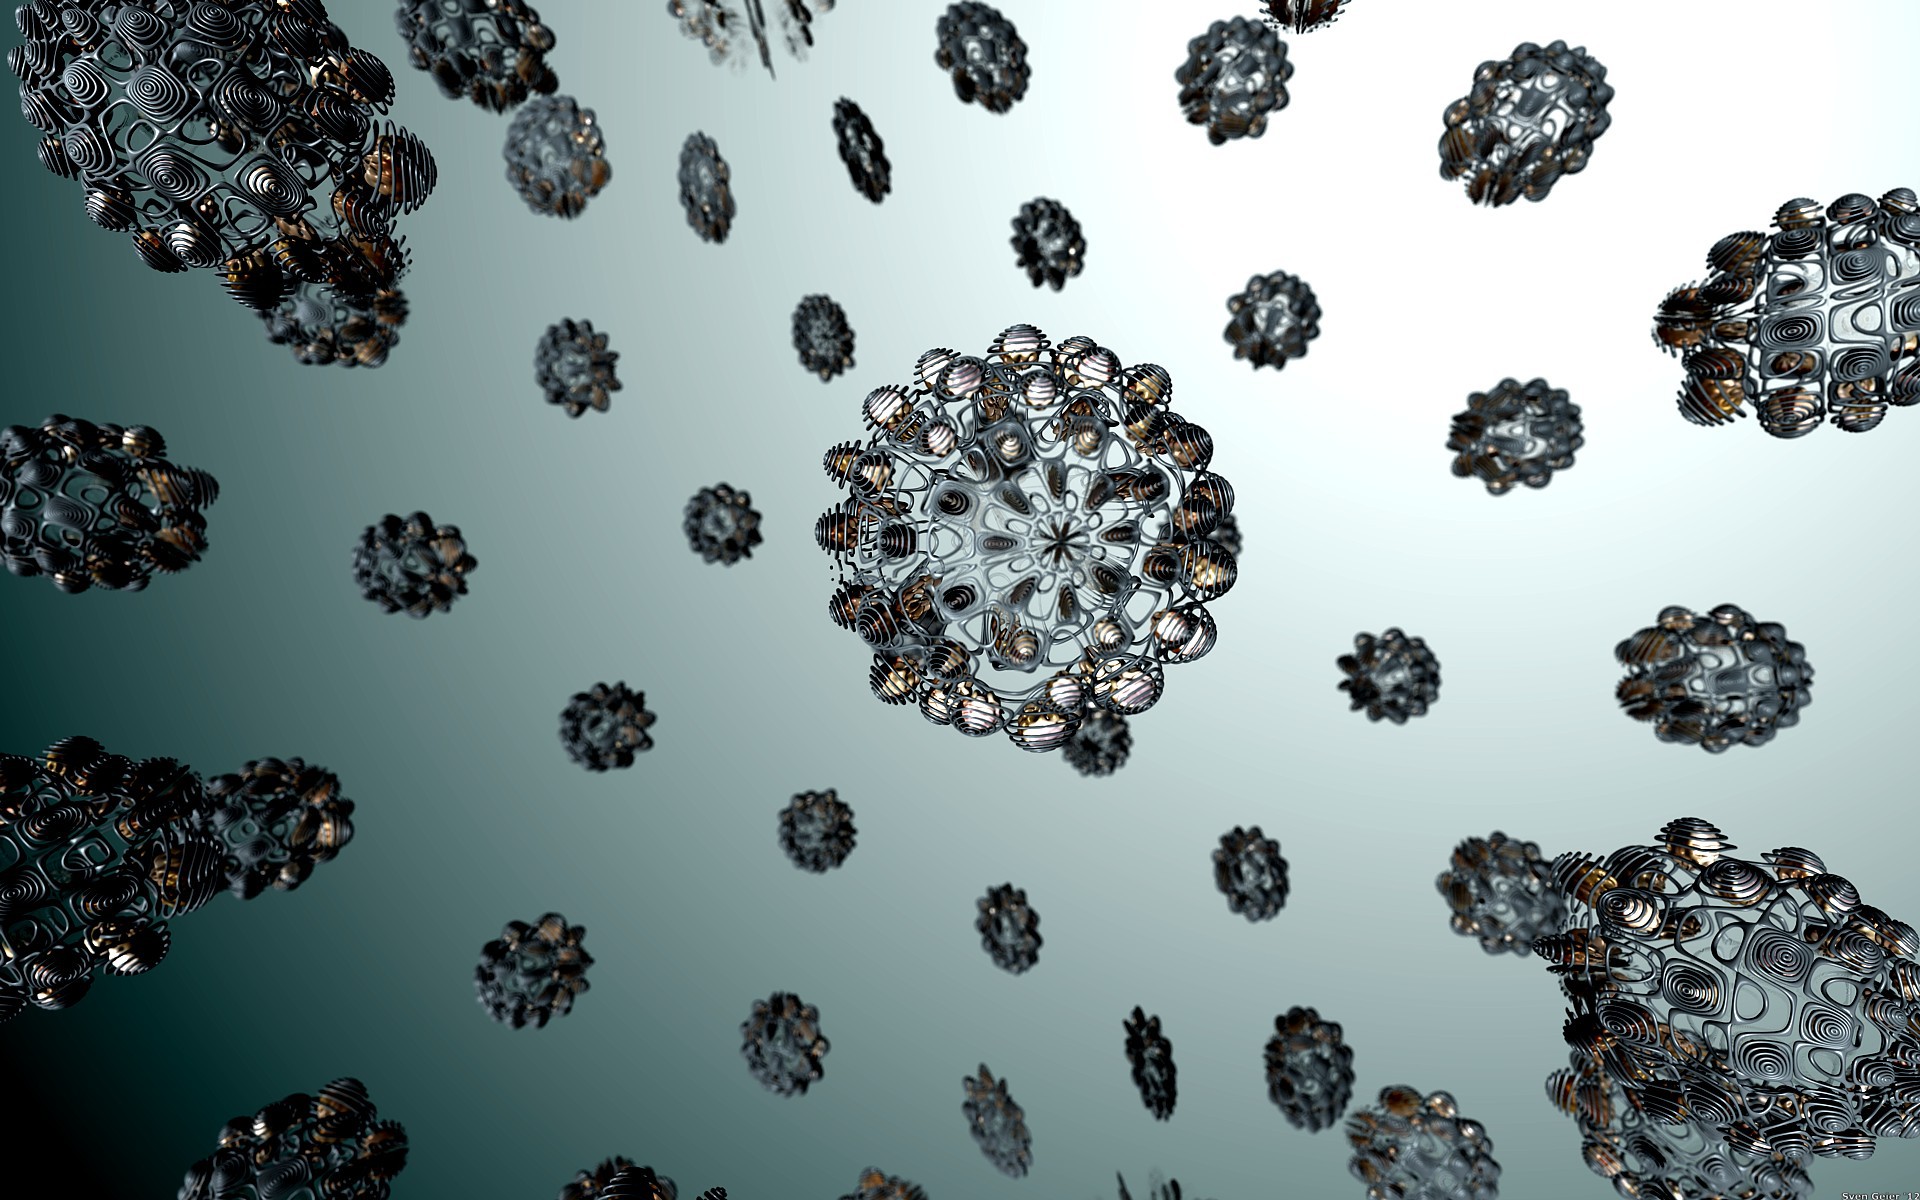
Finally, since I am controlling the estimator at this point, there is of course no reason why I can't combine these isopotential-line-surfaces with any kind of other structure for added visual interest:
Much more eye-candy
can be found in the galleries of
[2014] ,
[2013] ,
[2012] ,
[2011] ,
[2010] ,
[2009] ,
[2008] ,
[2007] ,
[2006] ,
[2005] ,
[2004] ,
[2003] ,
[2002] ,
[2001] ,
[flam3]